Some More Crime Stats for Conservatives to Ignore
The Globe has repeated an array of crime stats that I’m pretty damn sure Conservatives will ignore, all as part of an important article reminding us that there are GOOD legislators and legal minds out there.
The decision is an important one because it proves that not everyone is behind the idea of stacking yet-to-be-built prisons for the Conservative’s ‘put-everyone-in-jail-that-disagrees-with-us’ crime agenda.
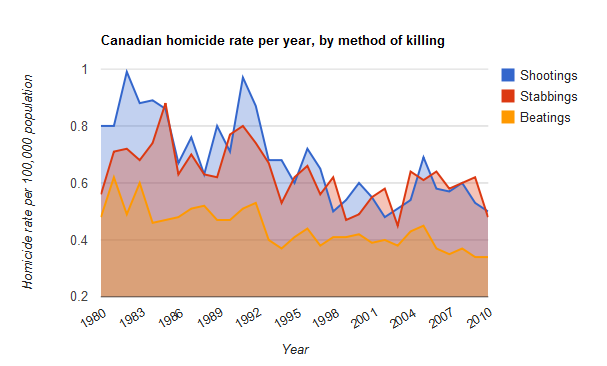
For those who aren’t familiar with these important stats, here’s another exhibit for you to send to your Conservative MP … even though they could care less about the reality of the situation.
Crime has dropped to a 44-year low. Why we’re committing so much time in the House of Commons to talk about crime, I do not understand.
Shootings:
- 1980: 0.8 per 100,000 population
- 2010: 0.5 per 100,000 population
- Change: 38% decrease
Stabbings:
- 1980: 0.56 per 100,000 population
- 2010: 0.48 per 100,000 population
- Change: 14% decrease
Beatings (including Conservative households):
- 1980: 0.48 per 100,000 population
- 2010: 0.34 per 100,000 population
- Change: 29% decrease
And if you have a few moments this afternoon, this page also offers up an interactive map of crime in Canada, seems to show that crime is not an urban issue, but a rural challenge.
In other words, the people that voted for the Conservatives also seem to be the most prone to violence. Of course, I don’t know this for a fact, but it would be fun to compare Conservative ridings with crime rates.
And if the hypothesis proves true, perhaps Darwinian politics will save Canada in the long run, as the Conservatives start to jail their own supporters with their ‘tough on crime’ agenda.
